Edit chart
Loading graph
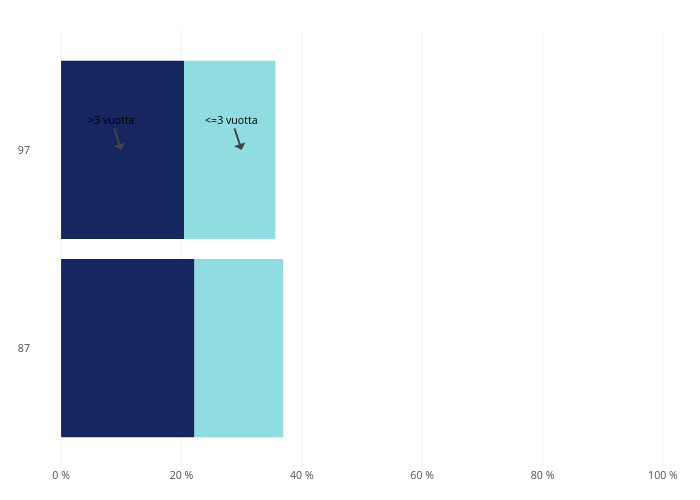
Itla's interactive graph and data of "Alle 3v vs Yli 3v" is a , showing Alle 3v vs Yli 3v. The x-axis shows values from -5 to 105. The y-axis shows values from 0.4 to 2.6. This visualization has the following annotations: >3 vuotta; <=3 vuotta